3. Orange County
Note
Self-Response Rates (SRR) DO NOT indicate the overall share of households or people counted in the census, but rather the share of housing units that filled out the form on their own.
City statistics such as population, race/ethnic demographic breakdown, and “hard-to-count” (HTC) characteristics are based on 2015-2019 ACS 5-year estimates and not the results of the 2020 Census.
See the Methodology section for information about how these numbers are calculated.
Orange County Summary
Orange County’s final 2020 self-response rate (SRR) was 76.6%, which was higher than its SRR in the 2010 census (71.7%) The lowest self-responding tracts in the county had a SRR in the 0-15% range while the highest self-responding tracts had a SRR in the 85-100% range.
116 tracts were among the bottom 20% lowest self-responding tracts in Orange County (below 71% SRR). Of those tracts, the largest share of the population was Hispanic/Latino of Any Race (54.3%) (mostly “Mexican” at 49.1%), followed by White (non-Hispanic) (29.1%). The most prominent hard-to-count (HTC) characteristics were households that were rented (65.8%), multi-unit structures (52.3%), and households that were non-family (35.4%).
Of the top 20% highest self-responding tracts in Orange County, the largest share of the population was White (non-Hispanic) (58.5%), followed by Asian (non-Hispanic) (19.6%) (mostly “Chinese” and “Vietnamese” at 4.6% and 4.1% respectively). The most prominent HTC characteristics were people born outside of the U.S. (20.9%) and households that were non-family (19.0%).
When looking at the Top and Bottom 20% Analysis, it is also important to note if any race/ethnic groups and HTC characteristics are under or overrepresented compared to their estimated share of the county’s population. For instance, the estimated White (non-Hispanic) population in Orange County is 40.6% but White (non-Hispanic) makes up 58.5% of the top 20% highest self-responding tracts in Orange County. On the other hand, the estimated Hispanic/Latino of Any Race population in Orange County is 34.1% but Hispanic/Latino of Any Race makes up 54.3% of the bottom 20% lowest self-responding tracts in the county.
The data and analysis in the Orange County Census Atlas is enriched by local knowledge and narratives about community efforts that may have contributed to a city or group’s increased self-response rate.
According to reports shared by Charitable Ventures Orange County, outreach partners funded by OC Counts conducted education, outreach, and questionnaire assistance activities that garnered the greatest number of impressions in Garden Grove, Orange, Anaheim, Santa Ana and Irvine. The top 5 activity types that created the most impressions were social media, advertising, “other,” “media_other” and phone banking. Other notable activities that garnered a significant amount of impressions were an in-language commercial aired on Khmer TV, street banners, full page ads on Korea Daily and Korea Times, and a Census Caravan in Santa Ana.
Reports collected from OC Counts’ funded partners also revealed that outreach activities that garnered the most impressions specifically from HTC groups were conducted in Orange, Santa Ana, Irvine, Garden Grove and Anaheim. Among HTC groups, social media, phonebanking, “other,” events, and collateral were the top 5 activity types that created the most impressions. Other notable activities that garnered a significant amount of impressions among HTC groups were the in-language commercial aired on Khmer TV; one-on-one conversations with friends, family and registered voters; scripts about the census on a toll free phone line; reminding drivers to fill out the census at drive-thru food drive; and census reminders incorporated into wellness or check-in calls during the COVID-19 pandemic.
For a more detailed overview of the OC Counts 2020 campaign, refer to the Orange County Census Playbook.
See the analysis, tables, graphs, and maps below for more details about Orange County and the “4. Cities” section for details about each of the 34 cities in Orange County.
| County Population | County Population Size Rank (of 58 counties) |
|---|---|
| 3,168,044 | 3 |
| County 2020 SRR | 2020 County SRR Rank (of 58 counties) |
|---|---|
| 76.6% | 5 |
| County 2010 SRR | 2010 County SRR Rank (of 58 counties) |
|---|---|
| 71.7% | 5 |
Additional data resources:
Census QuickFacts (source: U.S. Census Bureau)
Hard to Count fact sheets (source: California Complete Count - Census 2020 Office)
Census Reporter (source: Census Reporter, NFP, an Illinois not-for-profit corporation)
Race/Ethnic Demographic Breakdown
The following table shows the race/ethnic demographic distribution and final 2020 self-response rates (SRR) in the county. The listed SRR for race/ethnic groups refers to the calculated SRR for all census tracts where the group’s estimated share of the population is greater than or equal to the estimated share of the population for the county. It does not demonstrate the SRR of the whole group.
CORRECT INTERPRETATION: The calculated self-response rate in Orange County census tracts where the estimated Asian (non-Hispanic) population made up at least 20.3% of the population was 77.1%.
INCORRECT INTERPRETATION: The Asian (non-Hispanic) population had a self-response rate of 77.1% in Orange County.
Race/Ethnic demographic distribution and final calculated 2020 self-response rate in the county:
| Race/Ethnic Group | % of County Population | # of Census Tracts where % Population ≥ % Population in County | Final County SRR |
|---|---|---|---|
| AMERICAN INDIAN / ALASKA NATIVE | 0.2% | 160 | 77.1% |
| ASIAN* | 20.3% | 191 | 77.1% |
| Asian Indian | 1.8% | 168 | 78.0% |
| Chinese | 3.8% | 160 | 78.6% |
| Filipino | 2.6% | 199 | 77.4% |
| Japanese | 1.1% | 218 | 80.2% |
| Korean | 3.0% | 132 | 78.0% |
| Vietnamese | 6.6% | 122 | 77.5% |
| Other Asian | 1.7% | 205 | 77.6% |
| BLACK / AFRICAN AMERICAN | 1.6% | 212 | 75.6% |
| HISPANIC / LATINO OF ANY RACE | 34.1% | 213 | 73.1% |
| Mexican | 29.2% | 204 | 72.9% |
| Puerto Rican | 0.3% | 168 | 77.3% |
| Cuban | 0.4% | 202 | 75.6% |
| Other Hispanic/Latino | 4.2% | 236 | 76.1% |
| NATIVE HAWAIIAN / PACIFIC ISLANDER | 0.3% | 132 | 76.1% |
| SOME OTHER RACE | 0.2% | 157 | 77.6% |
| TWO OR MORE RACES | 2.8% | 251 | 78.7% |
| WHITE | 40.6% | 321 | 78.6% |
*The “ASIAN” race category does not include people of Hispanic/Latino origin, but the 7 ethnic Asian subcategories (eg, Korean, Other Asian) may include people of Hispanic/Latino origin.
“Hard-to-Count” (HTC) Characteristic Breakdown
The following table shows the “hard-to-count” (HTC) characteristics and final 2020 self-response rates (SRR) in the county. The SRR for a HTC characteristic refers to the calculated SRR in those census tracts where the characteristic’s estimated percentage is greater than or equal to the estimated percentage for the county. It does not demonstrate the SRR for specific types of households (i.e. that are rented) or populations (i.e. that are children under 5).
CORRECT INTERPRETATION: The calculated self-response rate for census tracts in Orange County where at least 42.6% of all occupied housing units were rented was 71.7%.
INCORRECT INTERPRETATION: Rented households had a self-response rate of 71.7% in Orange County.
See the Methodology section for more information on Hard-to-Count demographics.
“Hard-to-count” (HTC) characteristics and final calculated 2020 self-response rates in the county:
| HTC Characteristic | % of County Population | # of Census Tracts where % Characteristic ≥ % Characteristic in County | Final County SRR |
|---|---|---|---|
| PERCENT OF TOTAL HOUSING UNITS: | -- | -- | -- |
| That are vacant | 5.7% | 178 | 72.6% |
| In a multi-unit structure with 3 or more units | 32.7% | 249 | 72.4% |
| PERCENT OF HOUSEHOLDS (OR OCCUPIED HOUSING UNITS): | -- | -- | -- |
| That are rented | 42.6% | 268 | 71.7% |
| That are overcrowded (> 1.5 persons/room) | 3.2% | 187 | 71.5% |
| Without broadband subscriptions | 9.3% | 255 | 74.5% |
| With limited-English speaking ability | 8.7% | 231 | 74.6% |
| That are non-family (e.g. housemates, unmarried partners) | 28.3% | 222 | 73.2% |
| Receiving public assistance income | 1.9% | 229 | 75.1% |
| PERCENT OF THE POPULATION: | -- | -- | -- |
| That are children under 5 | 5.9% | 235 | 75.3% |
| That was born outside of the U.S. | 30.1% | 244 | 74.4% |
| Who moved to Orange County in the past year | 4.4% | 195 | 74.4% |
| With income below 150% of poverty level | 17.9% | 219 | 71.7% |
| Age 16 or older that are unemployed | 4.6% | 261 | 74.9% |
| Age 25 or older who are not high-school graduates | 14.5% | 208 | 73.7% |
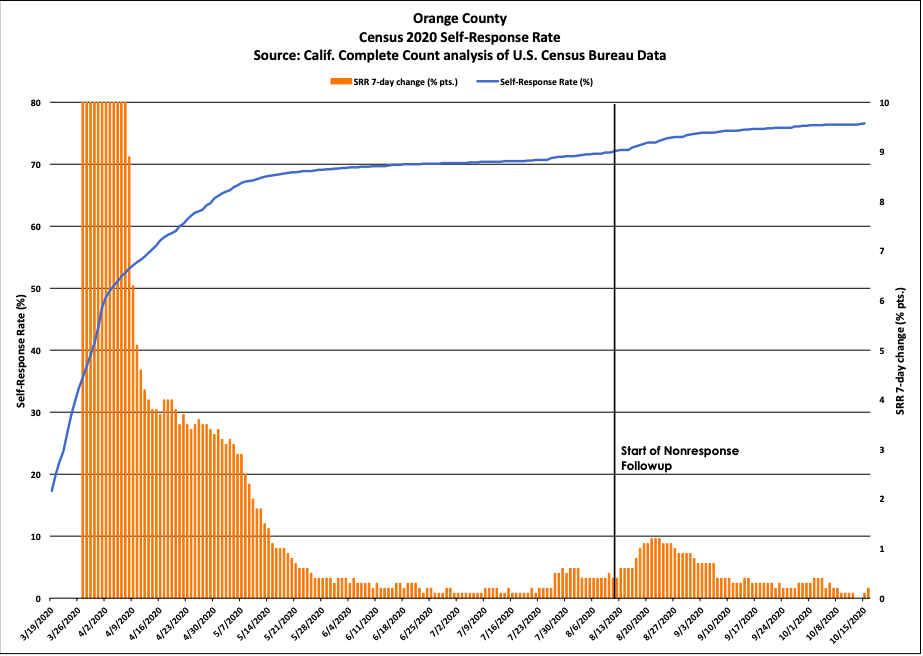
County-wide Self-Response Rates Over Time
Weekly self-response rates and weekly change in self-response rates in the county between March and October 2020:
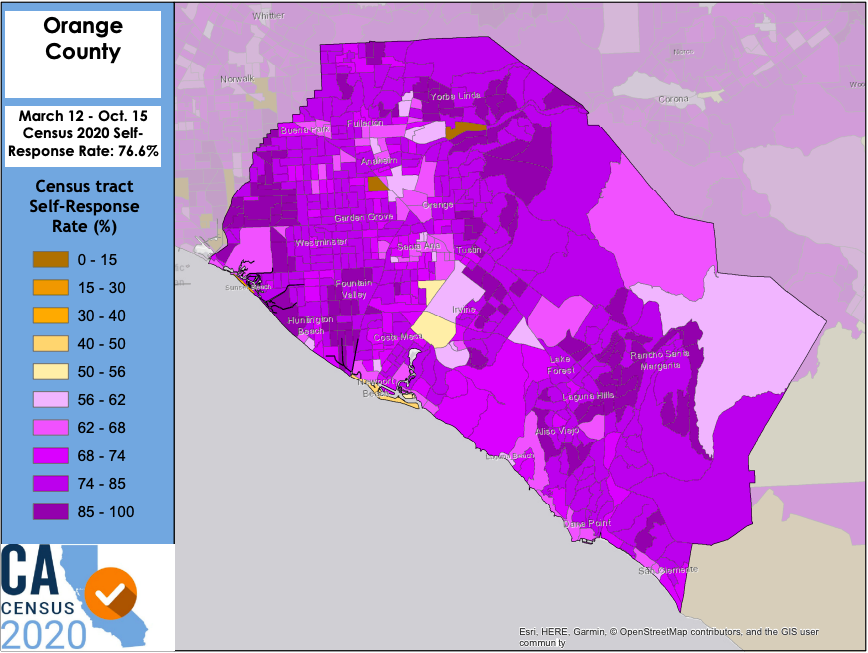
Self-Response Rates by Census Tract
The following map shows the final self-response rates (SRR) for every census tract that overlaps the county. As shown in the legend to the left of the map, the census tracts in dark purple have the highest SRR, and the census tracts in dark orange have the lowest SRR.
For more information about these census tracts, visit this interactive map from the California Complete Count - Census 2020 Office.
Map of final 2020 self-response rates for all census tracts in the county:
| City | Census tracts overlapping each city that are among the lowest self-responding tracts in Orange County (below 71% SRR) |
|---|---|
| Aliso Viejo | none |
| Anaheim | 06059011602, 06059011714, 06059011720, 06059076101, 06059076102, 06059086303, 06059086406, 06059086501, 06059086502, 06059086601, 06059086602, 06059086901, 06059087001, 06059087101, 06059087102, 06059087300, 06059087403, 06059087404, 06059087405, 06059087504, 06059087803, 06059087805, 06059087806 |
| Brea | 6059001404 |
| Buena Park | 06059001801, 06059110603 |
| Costa Mesa | 06059062610, 06059063301, 06059063605, 06059063701, 06059063702, 06059063807, 06059063808, 06059063907 |
| Cypress | none |
| Dana Point | 06059042201, 06059042305, 06059042313, 06059042323 |
| Fountain Valley | none |
| Fullerton | 06059001404, 06059001801, 06059001802, 06059011200, 06059011504, 06059011601, 06059011602, 06059011708, 06059011711 |
| Garden Grove | 6059088104 |
| Huntington Beach | 06059099241, 06059099306, 06059099310, 06059099311, 06059099402, 06059099410, 06059099411, 06059099506, 06059099513 |
| Irvine | 06059052404, 06059052518, 06059062610, 06059062611, 06059062614, 06059062626, 06059062627, 06059075515 |
| La Habra | 06059001201, 06059001401, 06059001404 |
| La Palma | none |
| Laguna Beach | 06059042305, 06059062605, 06059062619, 06059062620, 06059062632 |
| Laguna Hills | 6059042333 |
| Laguna Niguel | 6059042333 |
| Laguna Woods | none |
| Lake Forest | none |
| Los Alamitos | none |
| Mission Viejo | 6059042333 |
| Newport Beach | 06059062610, 06059062701, 06059062702, 06059062800, 06059062900, 06059063005, 06059063006, 06059063008, 06059063010, 06059063400, 06059063500, 06059063603 |
| Orange | 06059076000, 06059076101, 06059076102, 06059076204 |
| Placentia | 06059011708, 06059011711, 06059011720, 06059011721 |
| Rancho Santa Margarita | none |
| San Clemente | 06059042106, 06059042107, 06059042108 |
| San Juan Capistrano | 6059042201 |
| Santa Ana | 06059074003, 06059074300, 06059074403, 06059074405, 06059074406, 06059074407, 06059074501, 06059074601, 06059074602, 06059074701, 06059074702, 06059074801, 06059074802, 06059074805, 06059074806, 06059074901, 06059074902, 06059075002, 06059075003, 06059075004, 06059075403, 06059075515, 06059076000, 06059089004, 06059089105, 06059099249 |
| Seal Beach | 06059099502, 06059099506, 06059099511 |
| Stanton | 06059087803, 06059087805, 06059087806, 06059088104 |
| Tustin | 06059074407, 06059074408, 06059075514, 06059075515 |
| Villa Park | none |
| Westminster | 06059099241, 06059099905 |
| Yorba Linda | none |
Bottom 20% & Top 20% Analysis
The following table shows the race/ethnic and “hard-to-count” (HTC) characteristic make-up of the bottom 20% lowest responding census tracts and top 20% highest responding census tracts in the county. It does not demonstrate the self-response rate (SRR) of the whole group.
CORRECT INTERPRETATION: Of the bottom 20% lowest responding census tracts in Orange County, 54.3% of the population was Hispanic/Latino.
INCORRECT INTERPRETATION: The self-response rate for the Hispanic/Latino population in Orange County was 54.3%.
Demographic make-up of the bottom 20% lowest responding census tracts and top 20% highest responding census tracts in the county:
| Race/Ethnic Group | % of County Population | Bottom 20% | Top 20% |
|---|---|---|---|
| AMERICAN INDIAN / ALASKA NATIVE | 0.2% | 0.2% | 0.2% |
| ASIAN* | 20.3% | 12.2% | 19.6% |
| Asian Indian | 1.8% | 1.3% | 2.3% |
| Chinese | 3.8% | 2.8% | 4.6% |
| Filipino | 2.6% | 1.9% | 2.4% |
| Japanese | 1.1% | 0.5% | 1.8% |
| Korean | 3.0% | 1.5% | 2.8% |
| Vietnamese | 6.6% | 3.1% | 4.1% |
| Other Asian | 1.7% | 1.3% | 1.8% |
| BLACK / AFRICAN AMERICAN | 1.6% | 1.8% | 1.3% |
| HISPANIC / LATINO OF ANY RACE | 34.1% | 54.3% | 16.3% |
| Mexican | 29.2% | 49.1% | 12.1% |
| Puerto Rican | 0.3% | 0.4% | 0.4% |
| Cuban | 0.4% | 0.3% | 0.3% |
| Other Hispanic/Latino | 4.2% | 4.6% | 3.5% |
| NATIVE HAWAIIAN / PACIFIC ISLANDER | 0.3% | 0.3% | 0.2% |
| SOME OTHER RACE | 0.2% | 0.2% | 0.2% |
| TWO OR MORE RACES | 2.8% | 1.9% | 3.7% |
| WHITE | 40.6% | 29.1% | 58.5% |
*The “ASIAN” race category does not include people of Hispanic/Latino origin, but the 7 ethnic Asian subcategories (eg, Korean, Other Asian) may include people of Hispanic/Latino origin.
| HTC Characteristic | % of County Population | Bottom 20% | Top 20% |
|---|---|---|---|
| PERCENT OF TOTAL HOUSING UNITS: | -- | -- | -- |
| That are vacant | 5.7% | 10.5% | 2.8% |
| In a multi-unit structure with 3 or more units | 32.7% | 52.3% | 6.5% |
| PERCENT OF HOUSEHOLDS (OR OCCUPIED HOUSING UNITS): | -- | -- | -- |
| That are rented | 42.6% | 65.8% | 16.1% |
| That are overcrowded (> 1.5 persons/room) | 3.2% | 7.4% | 0.4% |
| Without broadband subscriptions | 9.3% | 12.7% | 6.2% |
| With limited-English speaking ability | 8.7% | 10.8% | 4.3% |
| That are non-family (e.g. housemates, unmarried partners) | 28.3% | 35.4% | 19.0% |
| Receiving public assistance income | 1.9% | 2.5% | 1.3% |
| PERCENT OF THE POPULATION: | -- | -- | -- |
| That are children under 5 | 5.9% | 6.6% | 4.7% |
| That was born outside of the U.S. | 30.1% | 34.4% | 20.9% |
| Who moved to Orange County in the past year | 4.4% | 5.5% | 2.9% |
| With income below 150% of poverty level | 17.9% | 29.4% | 7.8% |
| Age 16 or older that are unemployed | 4.6% | 5.2% | 3.9% |
| Age 25 or older who are not high-school graduates | 14.5% | 24.4% | 5.2% |
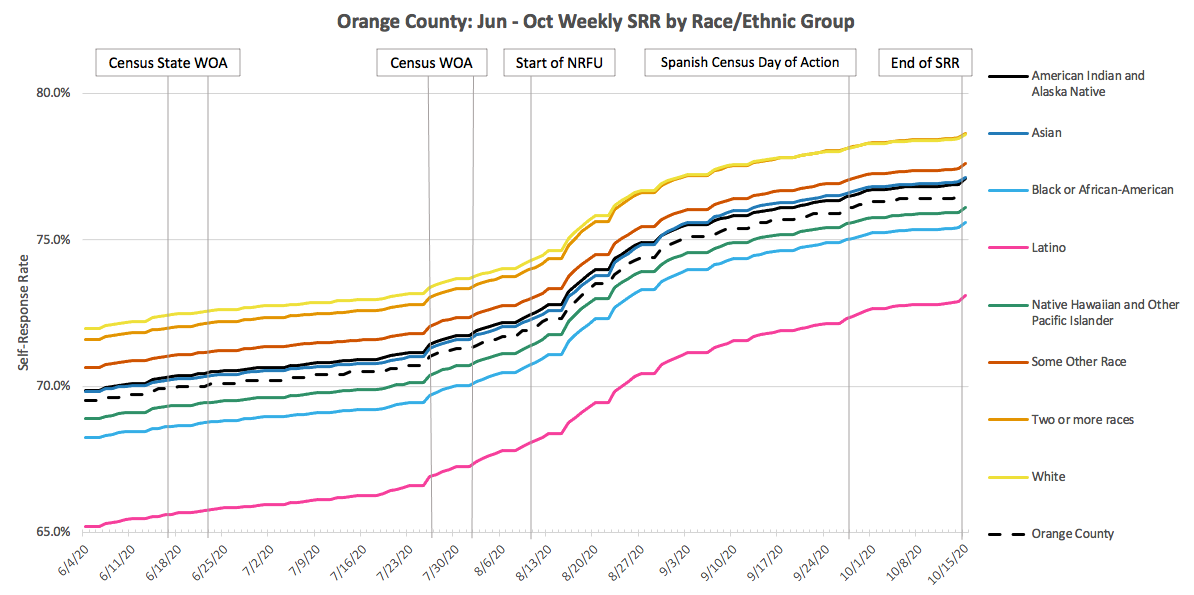
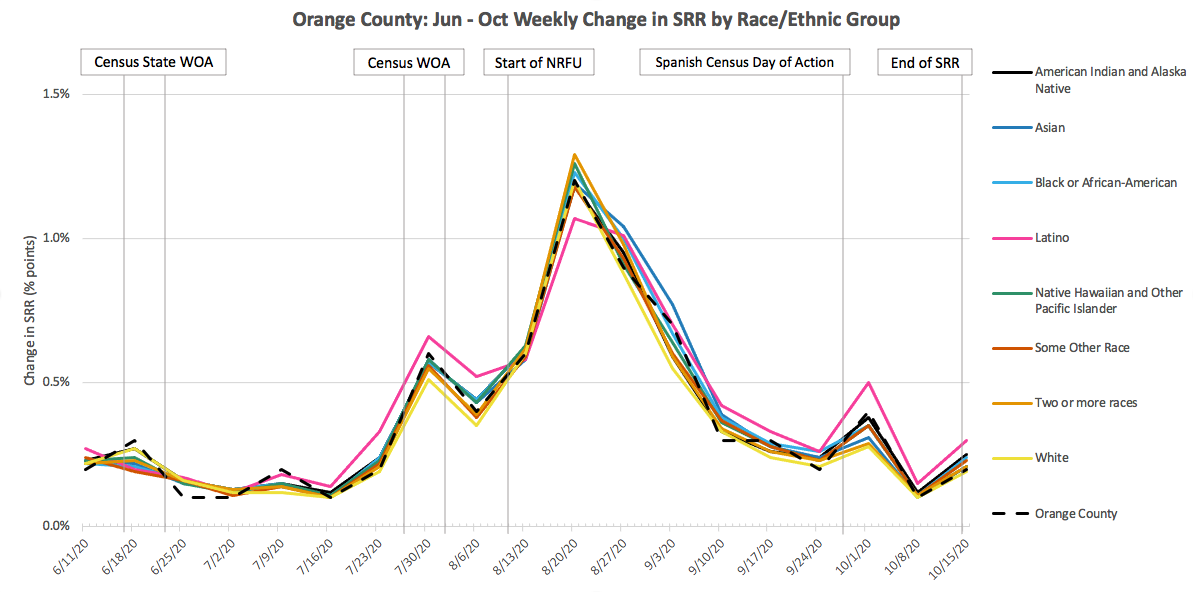
SRR Analysis - Race/Ethnic Group
The following graphs show the progression of self-response rates (SRR) over time in the county, disaggregated by race/ethnic group. Each data point represents the calculated SRR for all census tracts where the group’s share of the population is greater than or equal to their share of the population for the county. It does not demonstrate the SRR of the whole group.
For a city-by-city analysis of SRR for race/ethnic groups, see the Race/Ethnicity section.
June-Oct 2020 weekly self-response rates by race/ethnic group in the county, compared to county trends:
June-Oct 2020 weekly change in self-response rates by race/ethnic group in the county, compared to county trends:
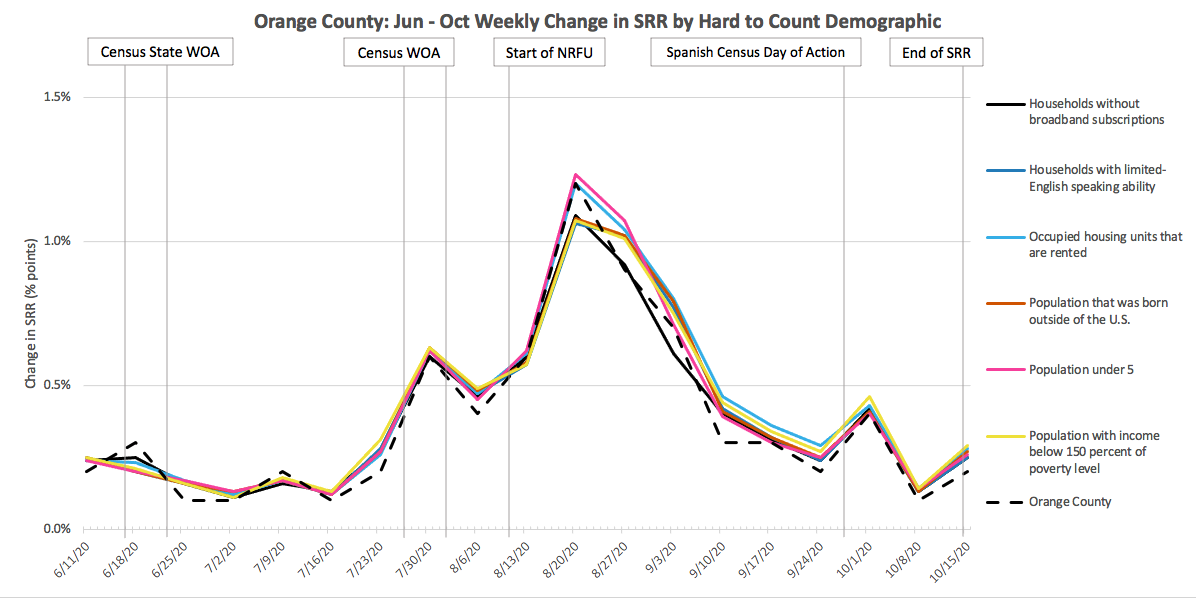
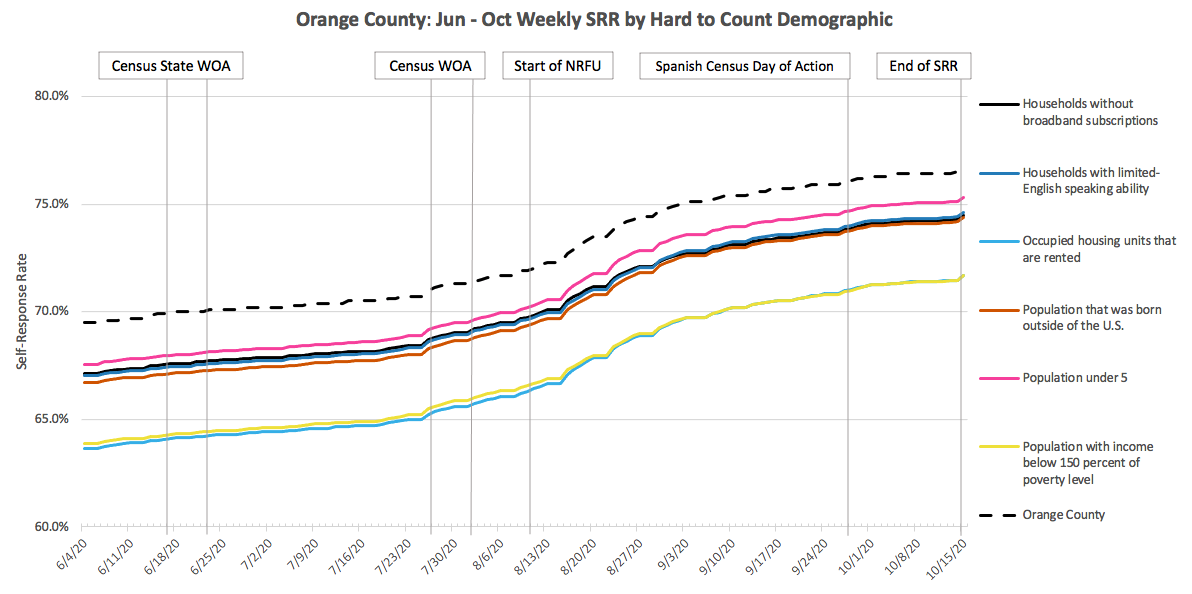
SRR Analysis - HTC Characteristic
The following graphs show the progression of self-response rates (SRR) over time in the county, disaggregated by select “hard-to-count” (HTC) characteristics. Each data point represents the calculated SRR in those census tracts where the characteristic’s estimated percentage is greater than or equal to the estimated percentage for the county. It does not demonstrate the SRR for specific types of households (i.e. that are rented) or populations (i.e. that are children under 5).
For a city-by-city analysis of SRR for select HTC demographics, see the “Hard-to-Count” (HTC) Characteristics section.
June-Oct 2020 weekly self-response rates for select HTC characteristics in the county, compared to county trends:
June-Oct 2020 weekly change in self-response rates for select HTC characteristics in the county, compared to county trends: