Buena Park
Note
Self-Response Rates (SRR) DO NOT indicate the overall share of households or people counted in the census, but rather the share of housing units that filled out the form on their own.
City statistics such as population, race/ethnic demographic breakdown, and “hard-to-count” (HTC) characteristics are based on 2015-2019 ACS 5-year estimates and not the results of the 2020 Census.
See the Methodology section for information about how these numbers are calculated.
City Summary
The City of Buena Park’s final 2020 self-response rate (SRR) was 78.4%, which was higher than its SRR in the 2010 census and higher than the SRR for Orange County (76.6%). The lowest self-responding tracts in the city had a SRR in the 62-68% range while the highest self-responding tracts had a SRR in the 85-100% range.
Of the bottom 20% lowest self-responding tracts in Orange County (116 tracts with an SRR below 71%), there were 2 census tracts that overlapped the City of Buena Park. Of those tracts, the largest share of the population was Hispanic/Latino of Any Race (61.2%) (mostly “Mexican” at 58.1%), followed by Asian (non-Hispanic) (19.2%). The most prominent hard-to-count (HTC) characteristics were households that were rented (81.3%), multi-unit structures (62.3%), people born outside of the U.S. (41.9%) and people with income below 150% of the poverty level (35.4%).
Of the top 20% highest self-responding tracts in Orange County that overlapped the City of Buena Park, the largest share of the population was White (non-Hispanic) (39.0%), followed by Asian (non-Hispanic) (30.6%) (mostly “Filipino” at 13.3%). The most prominent HTC characteristics were people born outside of the U.S. (35.4%) and households that were rented (19.1%).
When looking at the Top and Bottom 20% Analysis, it is also important to note if any race/ethnic groups and HTC characteristics are under or overrepresented compared to their estimated share of the city’s population. For instance, the estimated Hispanic/Latino of Any Race population in Buena Park is 37.9% but Hispanic/Latino of Any Race makes up 61.2% of the bottom 20% lowest self-responding tracts overlapping the City of Buena Park. See the analysis, tables, graphs, and maps below for more details.
| City Population | City Population Size Rank (of 34 cities) |
|---|---|
| 82,489 | 13 |
| City 2020 SRR | 2020 City SRR Rank (of 34 cities) |
|---|---|
| 78.4% | 19 |
| City 2010 SRR | 2010 City SRR Rank (of 34 cities) |
|---|---|
| 72.3% | 22 |
Additional data resources:
Census QuickFacts (source: U.S. Census Bureau)
Hard to Count fact sheets (source: California Complete Count - Census 2020 Office)
Census Reporter (source: Census Reporter, NFP, an Illinois not-for-profit corporation)
Race/Ethnic Demographic Breakdown
The following table shows the race/ethnic demographic distribution and final 2020 self-response rates (SRR) in the city, compared to Orange County. The listed SRR for race/ethnic groups refers to the calculated SRR for all census tracts where the group’s estimated share of the population is greater than or equal to the estimated share of the population for the total geography (e.g. the city or county). It does not demonstrate the SRR of the whole group.
CORRECT INTERPRETATION: The calculated self-response rate in Orange County census tracts where the estimated Asian (non-Hispanic) population made up at least 20.3% of the population was 77.1%.
INCORRECT INTERPRETATION: The Asian (non-Hispanic) population had a self-response rate of 77.1% in Orange County.
Race/Ethnic demographic distribution and final calculated 2020 self-response rate in the city, compared to Orange County:
| Race/Ethnic Group | % of City Population | % of County Population | # of Census Tracts where % Population ≥ % Population in City | # of Census Tracts where % Population ≥ % Population in County | Final City SRR | Final County SRR |
|---|---|---|---|---|---|---|
| AMERICAN INDIAN / ALASKA NATIVE | 0.3% | 0.2% | 6 | 160 | 75.7% | 77.1% |
| ASIAN* | 32.1% | 20.3% | 4 | 191 | 81.4% | 77.1% |
| Asian Indian | 4.1% | 1.8% | 6 | 168 | 82.6% | 78.0% |
| Chinese | 2.8% | 3.8% | 7 | 160 | 82.4% | 78.6% |
| Filipino | 9.1% | 2.6% | 8 | 199 | 80.1% | 77.4% |
| Japanese | 0.9% | 1.1% | 10 | 218 | 80.8% | 80.2% |
| Korean | 11.0% | 3.0% | 6 | 132 | 74.8% | 78.0% |
| Vietnamese | 2.5% | 6.6% | 8 | 122 | 77.3% | 77.5% |
| Other Asian | 2.1% | 1.7% | 8 | 205 | 80.6% | 77.6% |
| BLACK / AFRICAN AMERICAN | 2.9% | 1.6% | 9 | 212 | 76.1% | 75.6% |
| HISPANIC / LATINO OF ANY RACE | 37.9% | 34.1% | 10 | 213 | 73.9% | 73.1% |
| Mexican | 33.1% | 29.2% | 9 | 204 | 73.8% | 72.9% |
| Puerto Rican | 0.3% | 0.3% | 10 | 168 | 79.1% | 77.3% |
| Cuban | 0.2% | 0.4% | 5 | 202 | 75.2% | 75.6% |
| Other Hispanic/Latino | 4.4% | 4.2% | 8 | 236 | 77.7% | 76.1% |
| NATIVE HAWAIIAN / PACIFIC ISLANDER | 0.9% | 0.3% | 4 | 132 | 74.9% | 76.1% |
| SOME OTHER RACE | 0.1% | 0.2% | 6 | 157 | 77.2% | 77.6% |
| TWO OR MORE RACES | 2.3% | 2.8% | 8 | 251 | 79.8% | 78.7% |
| WHITE | 23.6% | 40.6% | 10 | 321 | 80.2% | 78.6% |
*The “ASIAN” race category does not include people of Hispanic/Latino origin, but the 7 ethnic Asian subcategories (e.g., Korean, Other Asian) may include people of Hispanic/Latino origin.
“Hard-to-Count” (HTC) Characteristic Breakdown
The following table shows the “hard-to-count” (HTC) characteristics and final 2020 self-response rates (SRR) in the city, compared to Orange County. The SRR for a HTC characteristic refers to the calculated SRR in those census tracts where the characteristic’s estimated percentage is greater than or equal to the estimated percentage for the total geography (e.g. the city or county). It does not demonstrate the SRR for specific types of households (i.e. that are rented) or populations (i.e. that are children under 5).
CORRECT INTERPRETATION: The calculated self-response rate for census tracts in Orange County where at least 42.6% of all occupied housing units were rented was 71.7%.
INCORRECT INTERPRETATION: Rented households had a self-response rate of 71.7% in Orange County.
See the Methodology section for more information on Hard-to-Count demographics.
“Hard-to-count” (HTC) characteristics and final calculated 2020 self-response rates in the city, compared to Orange County:
| HTC Characteristic | % of City Population | % of County Population | # of Census Tracts where % Characteristic ≥ % Characteristic in City | # of Census Tracts where % Characteristic ≥ % Characteristic in County | Final City SRR | Final County SRR |
|---|---|---|---|---|---|---|
| PERCENT OF TOTAL HOUSING UNITS: | -- | -- | -- | -- | -- | -- |
| That are vacant | 3.7% | 5.7% | 7 | 178 | 74.4% | 72.6% |
| In a multi-unit structure with 3 or more units | 30.4% | 32.7% | 9 | 249 | 73.5% | 72.4% |
| PERCENT OF HOUSEHOLDS (OR OCCUPIED HOUSING UNITS): | -- | -- | -- | -- | -- | -- |
| That are rented | 42.6% | 42.6% | 10 | 268 | 73.6% | 71.7% |
| That are overcrowded (> 1.5 persons/room) | 3.6% | 3.2% | 4 | 187 | 70.9% | 71.5% |
| Without broadband subscriptions | 9.7% | 9.3% | 9 | 255 | 74.0% | 74.5% |
| With limited-English speaking ability | 12.9% | 8.7% | 10 | 231 | 75.9% | 74.6% |
| That are non-family (e.g. housemates, unmarried partners) | 18.1% | 28.3% | 14 | 222 | 76.8% | 73.2% |
| Receiving public assistance income | 3.0% | 1.9% | 7 | 229 | 73.5% | 75.1% |
| PERCENT OF THE POPULATION: | -- | -- | -- | -- | -- | -- |
| That are children under 5 | 6.1% | 5.9% | 11 | 235 | 75.2% | 75.3% |
| That was born outside of the U.S. | 37.3% | 30.1% | 7 | 244 | 76.5% | 74.4% |
| Who moved to Orange County in the past year | 4.5% | 4.4% | 9 | 195 | 78.7% | 74.4% |
| With income below 150% of poverty level | 19.7% | 17.9% | 8 | 219 | 73.4% | 71.7% |
| Age 16 or older that are unemployed | 5.2% | 4.6% | 9 | 261 | 73.2% | 74.9% |
| Age 25 or older who are not high-school graduates | 16.0% | 14.5% | 9 | 208 | 73.0% | 73.7% |
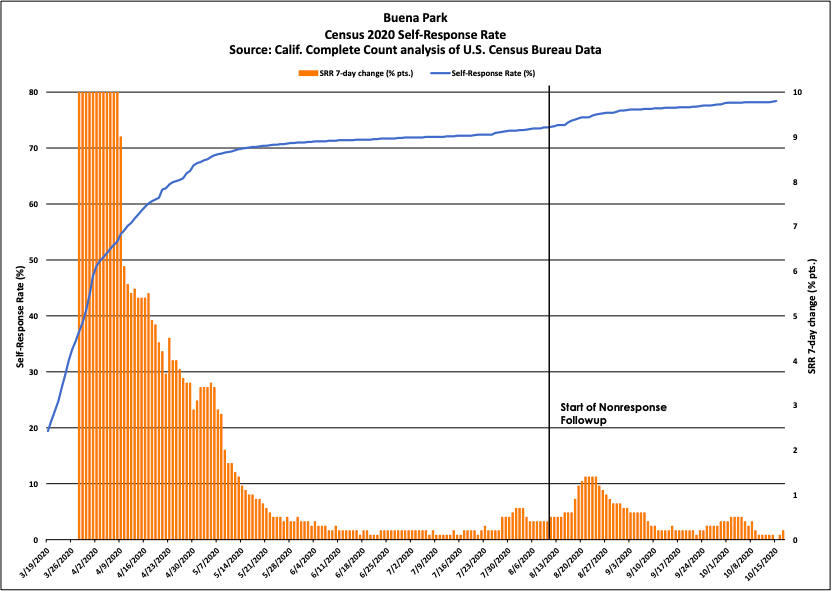
City-wide Self-Response Rates Over Time
Weekly self-response rates and weekly change in self-response rates in the city between March and October 2020:
Self-Response Rates by Census Tract
The following map shows the final self-response rates (SRR) for every census tract that overlaps the city. As shown in the legend to the left of the map, the census tracts in dark purple have the highest SRR, and the census tracts in dark orange have the lowest SRR.
For more information about these census tracts, visit this interactive map from the California Complete Count - Census 2020 Office.
Map of final 2020 self-response rates for all census tracts that overlap the city:
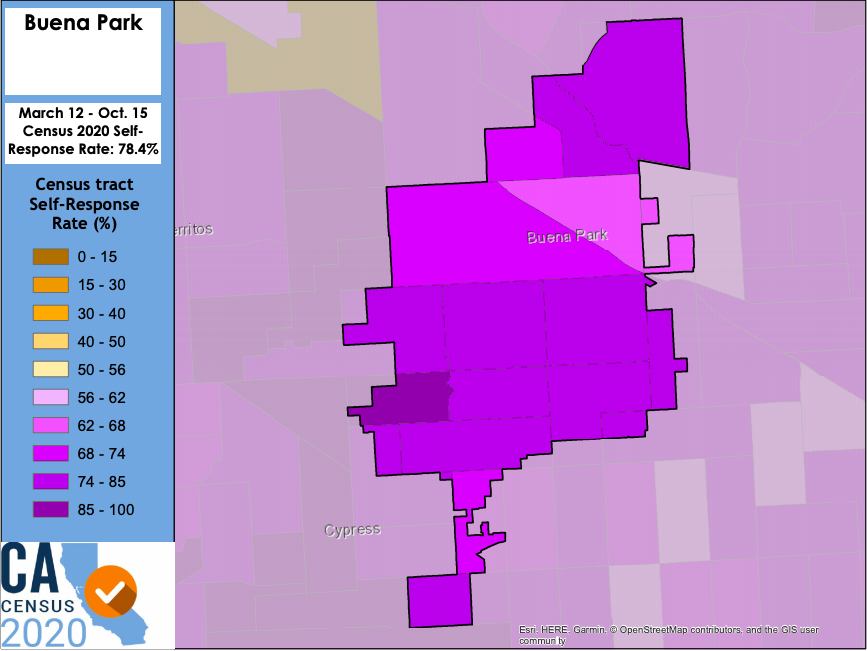
| Census tracts overlapping the city that are among the lowest self-responding tracts in Orange County (below 71% SRR) |
|---|
| 06059001801, 06059110603 |
Bottom 20% Analysis
The following table shows the race/ethnic and “hard-to-count” (HTC) characteristic make-up of the bottom 20% lowest responding census tracts that overlap the city, compared to Orange County. It does not demonstrate the self-response rate (SRR) of the whole group.
CORRECT INTERPRETATION: Of the bottom 20% lowest responding census tracts in Orange County, 54.3% of the population was Hispanic/Latino.
INCORRECT INTERPRETATION: The self-response rate for the Hispanic/Latino population in Orange County was 54.3%.
Demographic make-up of the bottom 20% lowest responding census tracts that overlap the city, compared to Orange County:
| Race/Ethnic Group | City | County |
|---|---|---|
| AMERICAN INDIAN / ALASKA NATIVE | 0.2% | 0.2% |
| ASIAN* | 19.2% | 12.2% |
| Asian Indian | 1.4% | 1.3% |
| Chinese | 1.6% | 2.8% |
| Filipino | 2.6% | 1.9% |
| Japanese | 0.3% | 0.5% |
| Korean | 10.5% | 1.5% |
| Vietnamese | 2.9% | 3.1% |
| Other Asian | 0.0% | 1.3% |
| BLACK / AFRICAN AMERICAN | 1.1% | 1.8% |
| HISPANIC / LATINO OF ANY RACE | 61.2% | 54.3% |
| Mexican | 58.1% | 49.1% |
| Puerto Rican | 0.4% | 0.4% |
| Cuban | 0.3% | 0.3% |
| Other Hispanic/Latino | 2.5% | 4.6% |
| NATIVE HAWAIIAN / PACIFIC ISLANDER | 0.1% | 0.3% |
| SOME OTHER RACE | 0.1% | 0.2% |
| TWO OR MORE RACES | 1.0% | 1.9% |
| WHITE | 17.1% | 29.1% |
*The “ASIAN” race category does not include people of Hispanic/Latino origin, but the 7 ethnic Asian subcategories (eg, Korean, Other Asian) may include people of Hispanic/Latino origin.
| HTC Characteristic | City | County |
|---|---|---|
| PERCENT OF TOTAL HOUSING UNITS: | -- | -- |
| That are vacant | 5.0% | 10.5% |
| In a multi-unit structure with 3 or more units | 62.3% | 52.3% |
| PERCENT OF HOUSEHOLDS (OR OCCUPIED HOUSING UNITS): | -- | -- |
| That are rented | 81.3% | 65.8% |
| That are overcrowded (> 1.5 persons/room) | 8.4% | 7.4% |
| Without broadband subscriptions | 12.5% | 12.7% |
| With limited-English speaking ability | 20.7% | 10.8% |
| That are non-family (e.g. housemates, unmarried partners) | 18.5% | 35.4% |
| Receiving public assistance income | 4.9% | 2.5% |
| PERCENT OF THE POPULATION: | -- | -- |
| That are children under 5 | 6.4% | 6.6% |
| That was born outside of the U.S. | 41.9% | 34.4% |
| Who moved to Orange County in the past year | 3.5% | 5.5% |
| With income below 150% of poverty level | 35.4% | 29.4% |
| Age 16 or older that are unemployed | 8.8% | 5.2% |
| Age 25 or older who are not high-school graduates | 30.5% | 24.4% |
Top 20% Analysis
The following table shows the race/ethnic and “hard-to-count” (HTC) characteristic make-up of the top 20% highest responding census tracts that overlap the city, compared to Orange County. It does not demonstrate the self-response rate (SRR) of the whole group.
CORRECT INTERPRETATION: Of the top 20% highest responding census tracts in Orange County, 58.5% of the population was White (non-Hispanic).
INCORRECT INTERPRETATION: The self-response rate for the White (non-Hispanic) population in Orange County was 58.5%.
Demographic make-up of the top 20% highest responding census tracts that overlap the city, compared to Orange County:
| Race/Ethnic Group | City | County |
|---|---|---|
| AMERICAN INDIAN / ALASKA NATIVE | 0.0% | 0.2% |
| ASIAN* | 30.6% | 19.6% |
| Asian Indian | 4.8% | 2.3% |
| Chinese | 4.4% | 4.6% |
| Filipino | 13.3% | 2.4% |
| Japanese | 2.4% | 1.8% |
| Korean | 3.6% | 2.8% |
| Vietnamese | 2.0% | 4.1% |
| Other Asian | 0.2% | 1.8% |
| BLACK / AFRICAN AMERICAN | 2.7% | 1.3% |
| HISPANIC / LATINO OF ANY RACE | 27.0% | 16.3% |
| Mexican | 22.5% | 12.1% |
| Puerto Rican | 0.6% | 0.4% |
| Cuban | 1.0% | 0.3% |
| Other Hispanic/Latino | 3.0% | 3.5% |
| NATIVE HAWAIIAN / PACIFIC ISLANDER | 0.0% | 0.2% |
| SOME OTHER RACE | 0.0% | 0.2% |
| TWO OR MORE RACES | 0.7% | 3.7% |
| WHITE | 39.0% | 58.5% |
*The “ASIAN” race category does not include people of Hispanic/Latino origin, but the 7 ethnic Asian subcategories (eg, Korean, Other Asian) may include people of Hispanic/Latino origin.
| HTC Characteristic | City | County |
|---|---|---|
| PERCENT OF TOTAL HOUSING UNITS: | -- | -- |
| That are vacant | 3.1% | 2.8% |
| In a multi-unit structure with 3 or more units | 2.0% | 6.5% |
| PERCENT OF HOUSEHOLDS (OR OCCUPIED HOUSING UNITS): | -- | -- |
| That are rented | 19.1% | 16.1% |
| That are overcrowded (> 1.5 persons/room) | 0.8% | 0.4% |
| Without broadband subscriptions | 9.1% | 6.2% |
| With limited-English speaking ability | 9.9% | 4.3% |
| That are non-family (e.g. housemates, unmarried partners) | 13.1% | 19.0% |
| Receiving public assistance income | 1.2% | 1.3% |
| PERCENT OF THE POPULATION: | -- | -- |
| That are children under 5 | 5.2% | 4.7% |
| That was born outside of the U.S. | 35.4% | 20.9% |
| Who moved to Orange County in the past year | 3.3% | 2.9% |
| With income below 150% of poverty level | 8.4% | 7.8% |
| Age 16 or older that are unemployed | 6.9% | 3.9% |
| Age 25 or older who are not high-school graduates | 10.6% | 5.2% |
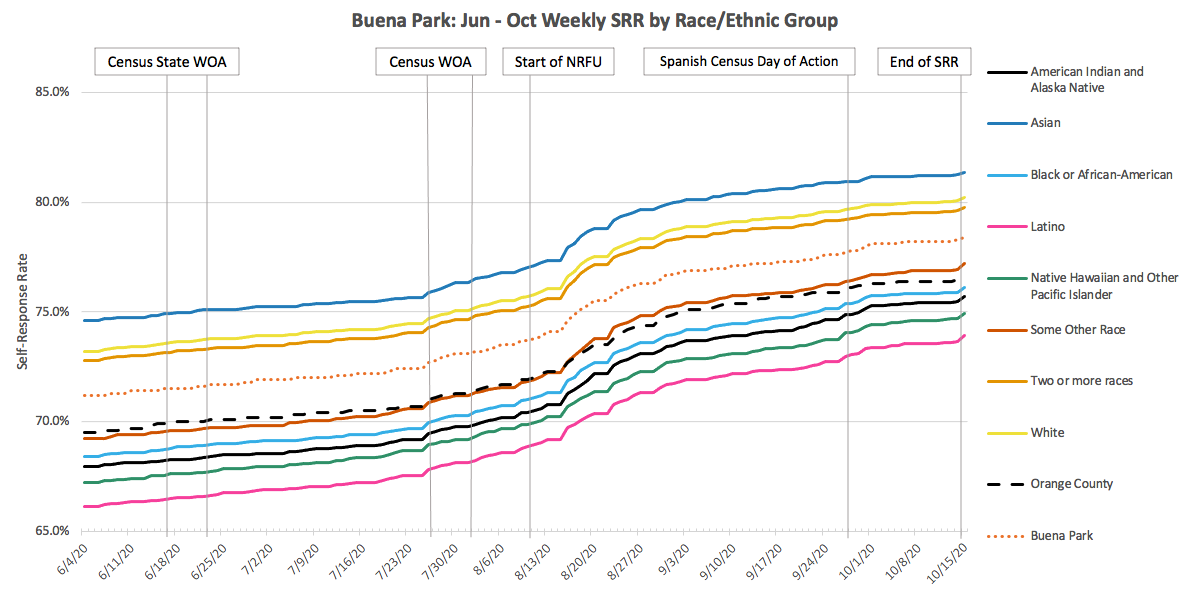
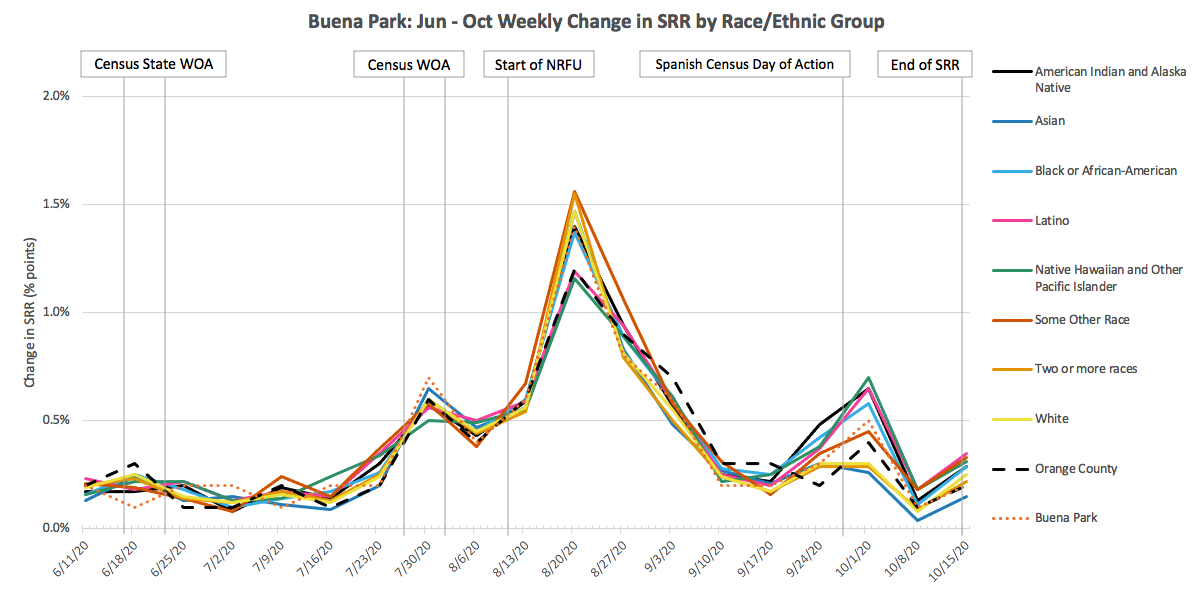
SRR Analysis - Race/Ethnic Group
The following graphs show the progression of self-response rates (SRR) over time in the city, disaggregated by race/ethnic group. Each data point represents the calculated SRR for all census tracts where the group’s share of the population is greater than or equal to their share of the population for the total geography (e.g. the city or county). It does not demonstrate the SRR of the whole group.
For a city-by-city analysis of SRR for race/ethnic groups, see the Race/Ethnicity section.
June-Oct 2020 weekly self-response rates by race/ethnic group, compared to city and county trends:
June-Oct 2020 weekly change in self-response rates by race/ethnic group, compared to city and county trends:
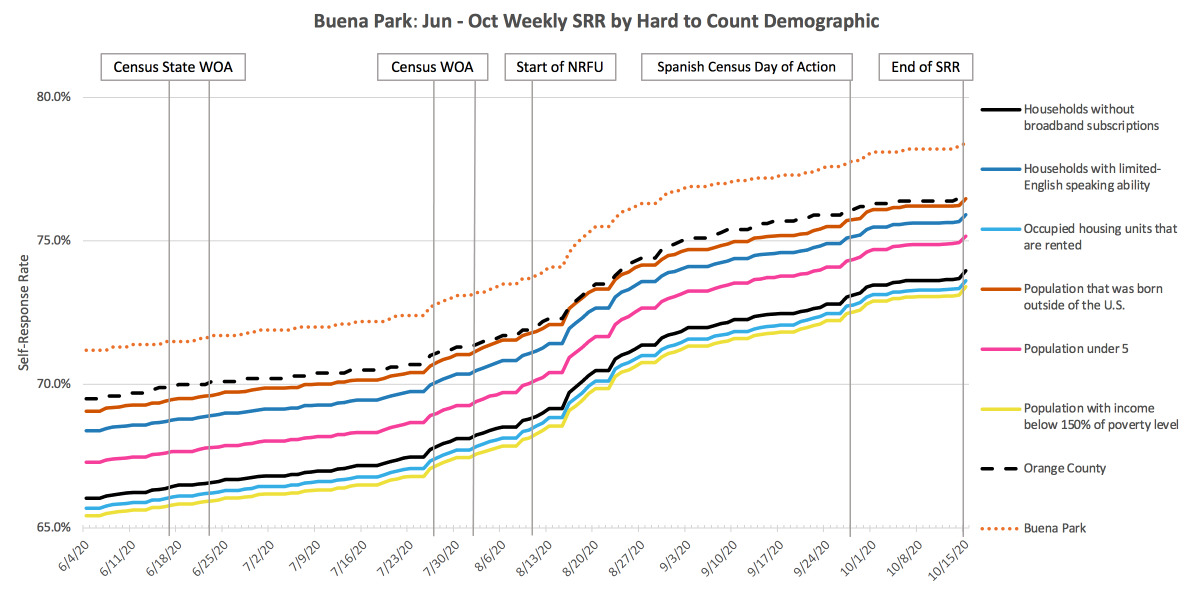
SRR Analysis - HTC Characteristic
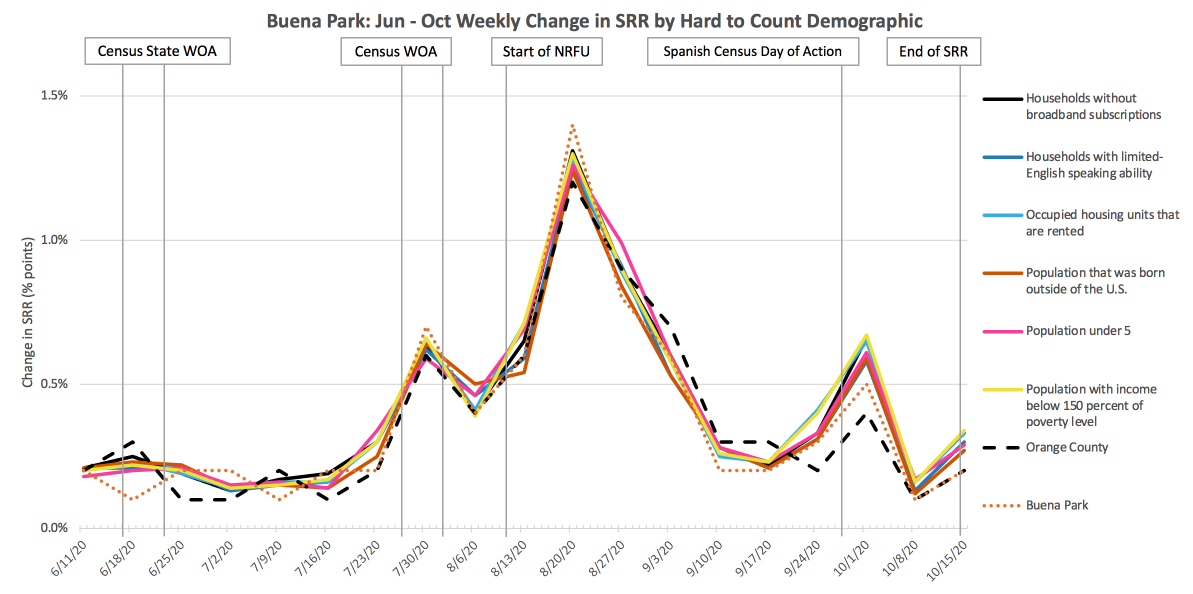
The following graphs show the progression of self-response rates (SRR) over time in the city, disaggregated by select “hard-to-count” (HTC) characteristics. Each data point represents the calculated SRR in those census tracts where the characteristic’s estimated percentage is greater than or equal to the estimated percentage for the total geography (e.g. the city or county). It does not demonstrate the SRR for specific types of households (i.e. that are rented) or populations (i.e. that are children under 5).
For a city-by-city analysis of SRR for select HTC demographics, see the HTC Characteristic section.
June-Oct 2020 weekly self-response rates for select HTC characteristics, compared to city and county trends:
June-Oct 2020 weekly change in self-response rates for select HTC characteristics, compared to city and county trends: